Voter Migration 2017-2019
1. Introduction
The key driver of the December 2019 election result was the group of voters who chose to vote differently from 2017. Using polling data, Electoral Calculus has identified and analysed these voters to see which parties they switched to and from.
Since Brexit was obviously an important factor in people's decisions, voters were also identified by how they voted in the EU referendum of 2016 (as Leavers, Remainers, or those who didn't vote then).
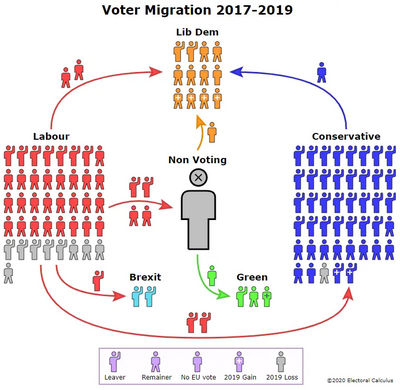
The migration graphic below shows the results of the analysis. Each figure represents one per cent of those who voted in the 2017 general election, which is equivalent to about 300,000 actual voters. The colour of each figure indicates which party they voted for in 2017. Their shape represents how they voted at the EU referendum ('hand wave' for Leavers, 'feet astride' for Remainers, and a static figure for those too young or apathetic to have voted then).

The migration flows, indicated by the arrows, show how voters have changed their minds since 2017, and indicate the transfer of votes at the 2019 election. Parties which lost votes in 2019, such as Labour, have their ranks thinned by lost voters (coloured in grey) who supported them in 2017 but switched away in 2019. Parties which gained votes in 2019 have their ranks augmented by figures bearing a plus sign (+) who are new supporters of that party in 2019.
Also important this year were voters who did not choose to vote, which are indicated by the big grey figure in the middle. Some voters did not vote in 2017 but did vote in 2019, and they are represented by figures coming out of the non-voting area. Other voters did vote in 2017 but not in 2019 and they are shown going into the non-voting area.
2. Analysis
In 2017, the Conservatives won 43pc of the GB vote, with Labour on 41pc and the Liberal Democrats on 8pc. The Greens and UKIP got about 2pc each. This is shown in the sizes of the party blocks (including grey voters but ignoring 'plus' voters). The remaining 5pc of voters voted for the SNP, Plaid Cymru and minor parties.
We can also see the breakdown by EU referendum vote. Most but not all Conservative voters were Leave supporters, and the 43 Conservative voters were divided into 31 Leavers, 11 Remainers and one who didn't vote in the EU referendum. The 41 Labour supporters are divided into 26 Remainers, 12 Leavers and three who didn't vote (possibly because they were too young in 2016). The eight Liberal Democrats were split 5-2 in favour of Remain with one non-voter. The Greens had both Remainers and Leavers, but UKIP (shown now in Brexit colours) was solidly Leave.
In terms of voter migration, the main story is that voters left Labour. Nine out of 41 voters left. They left for different reasons and went to different places, but they left. That partial collapse of the Labour vote is the most important fact of the 2019 election and explains why Labour did so badly. By comparison, the Conservatives were relatively stable and gained seats because Labour weakened.
The largest group of Labour defectors were the four supporters who chose not to vote. They could be solid Labour voters who were disenchanted by the Labour leadership and were uncomfortable in one way or another with the party's Brexit stance. This group played an important role in Labour's defeat, but those people could easily return to Labour at the next general election once Brexit is completed and if Labour's new leadership is more attractive.
Three other Labour leavers went to vote for either the Conservatives or the Brexit party.
On the other side, two Labour remainers defected to the Liberal Democrats, presumably attracted by their more hard-line Remain stance.
The Liberal Democrats also gained a Remain voter from the Conservatives, and a new voter who had not voted in 2017. Altogether that increased their vote share nationally, but those votes were scattered across seats and they were not able to translate their increased support into seat gains.
The Conservatives were notably static. They gained a couple of Leave voters from Labour and lost one Remain voter to the Lib Dems. But otherwise their supporters stood remarkably loyal. Most significant was the significant group of Conservative Remainers who (mostly) did not defect to other parties. The failure of the Lib Dems to attract more of those voters was a big setback for the Lib Dems and a strong positive for the Conservatives. If half of Conservative Remainers had gone to the Liberal Democrats, the Conservatives might have won just 325 seats and been short of an outright majority again.
3. Conclusions
The 2019 election result was driven by two key trends. The first was the semi-collapse of the Labour vote, with both Leave and Remain Labour voters deserting the party. The second was the strength of the Conservative party in retaining its Remain supporters despite its drive for Brexit. Taken together, these two trends weakened Labour relative to the Conservatives in seats across the country and enabled the Conservatives to gain nearly fifty seats.
For the next election, both major parties will be eyeing the Liberal Democrats to see if they can recapture their "lost" voters. Labour should also be thinking about how to get those Labour-leaning abstainers back into the habit of voting Labour. That is Labour's largest group of lost voters and they may be easier to win back than those that actively defected to other parties.
The final big question is how the Brexit process will play out. If Brexit goes smoothly, it may become less controversial and the Leave/Remain divide will fade away. But if passions stay strong, then Brexit may define British politics for some time to come.